Social Media is in a Bear Market
A deep dive into website traffic reveals winter is coming for social media platforms...
Hiiiiiiiii have you noticed a dip in your social numbers? Wondering if it’s because the algorithms are working against you, you’ve been shadow banned or worse….. your content actually sucks? This could all be true. Haha jk! It’s much worse! Social media is dying a slow death and we’ll likely never see the same engagement and growth we’ve been accustomed to in years past.
I was curious about Elon Musk’s effect on Twitter’s numbers. I couldn’t help but wonder…are people actually leaving Twitter because of him? What platform is everyone moving to? Why is no one liking any of my Mastodon posts? Where is everyone? Hello? Is anyone there?
I dug into Twitter.com website traffic of the past 90 days (via SimiliarWeb) and created the below graphs to highlight a large downtrend across social media platforms featuring giant red lines and actual math (run roh!). I turned this around super quickly so please excuse any grammar or spelling mistakes 🤭
I will follow-up with a part 2 on what this all means…
Twitter.com Website Traffic is Declining 9%
The total website visits from the last 28 days to Twitter.com are down 9%.
This is significant because it is the same month that Twitter optimized for desktop usage by offering subscriptions for $8 vs. $11 through the app.


However, is this a Twitter thing or is there a larger social media trend at play. Let’s dive in….
Twitter.com Website Referrals via other Social Platforms is declining 36%
Social traffic to Twitter from other platforms usually drives ~4% of total traffic. However, we can see that this is down 36.41%, accounting for only 3.6% of referral traffic through the months of September - today (December 21, 2022).
Are less pages referring traffic to Twitter or is Twitter just experiencing the compounding effects of slow growth and less traffic felt by all platforms?
Website Visits Across Social Platforms are Declining
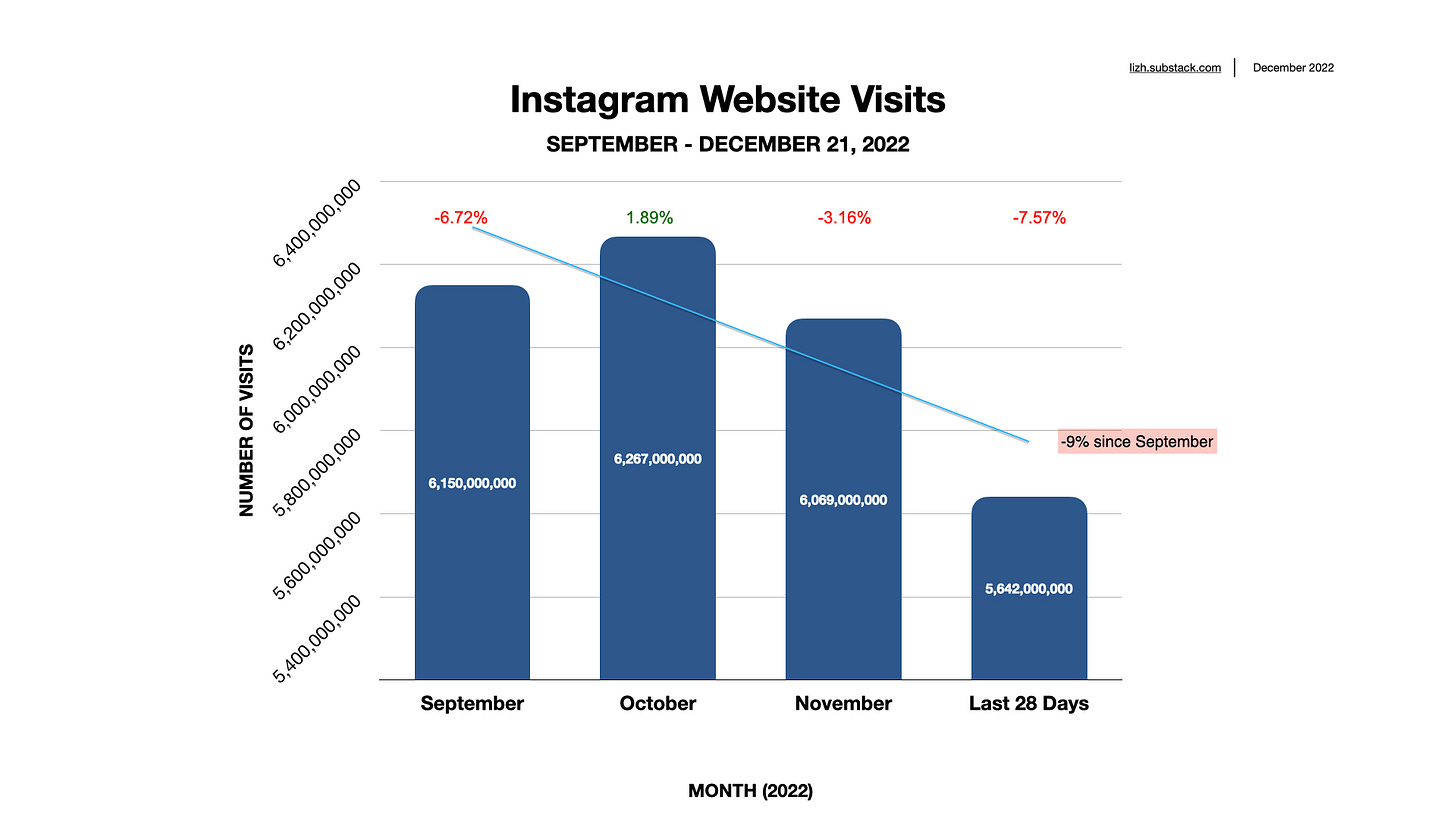
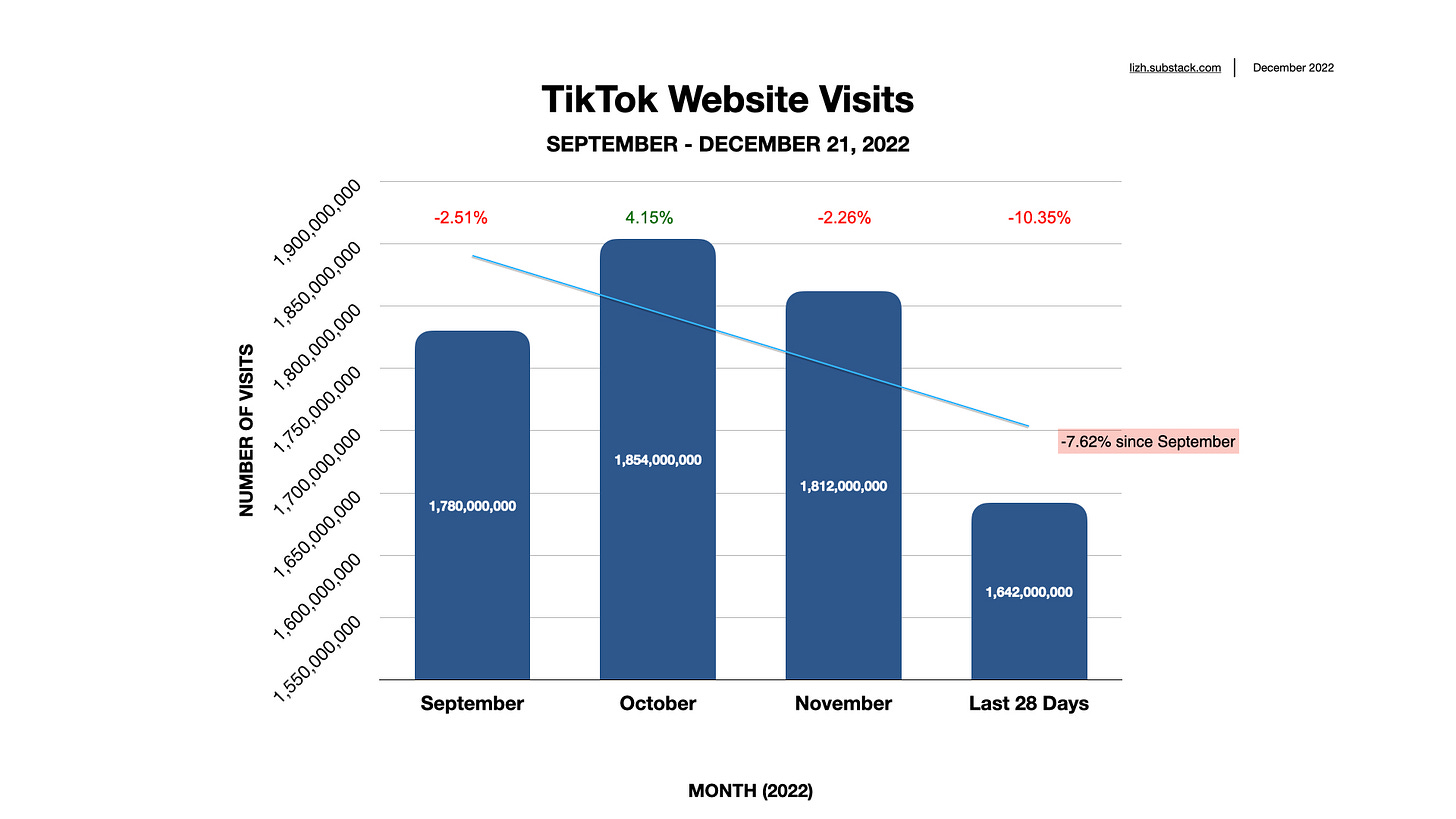
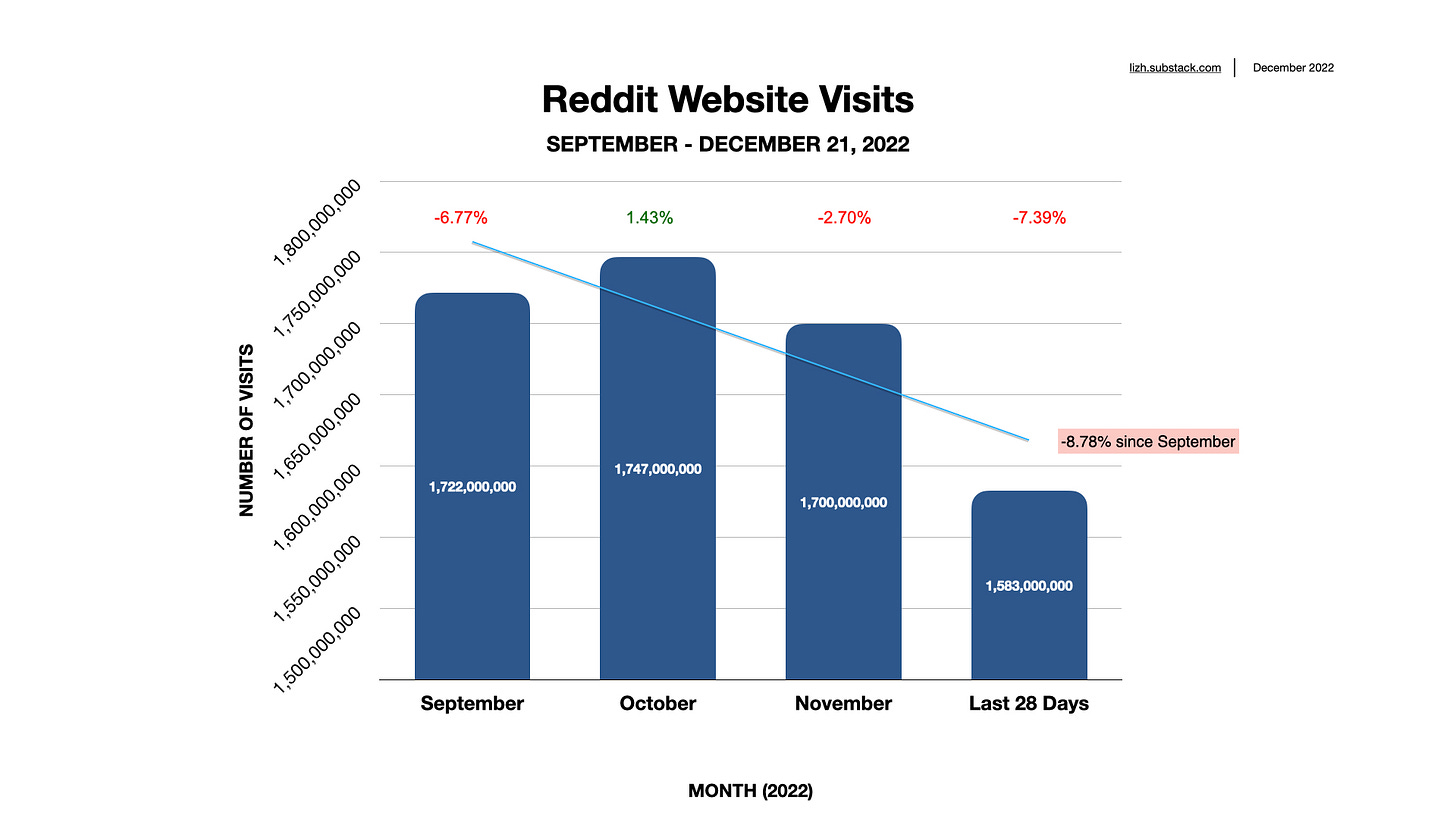
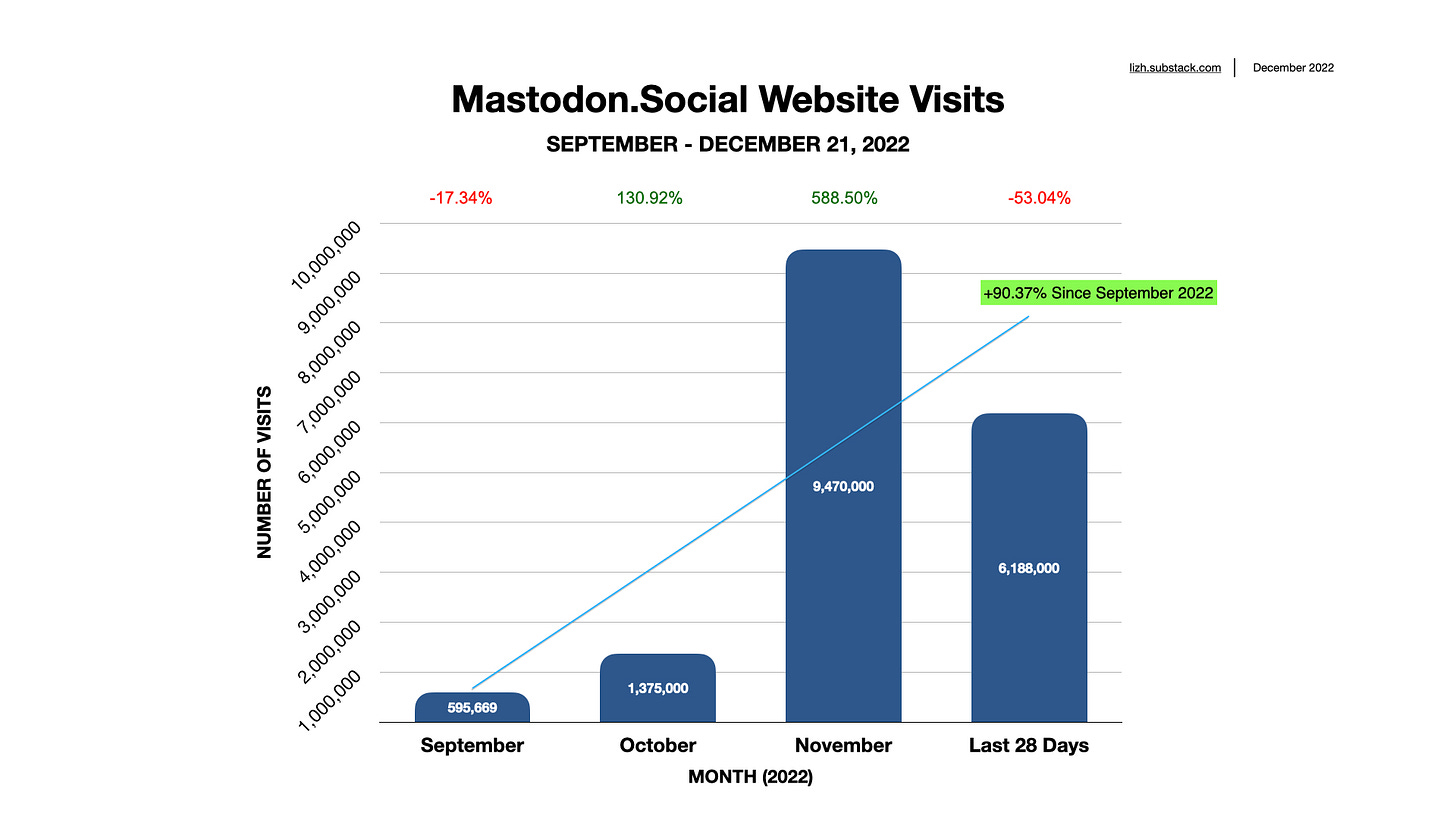
Please find website visits for BeReal, Reddit, Instagram, Mastodon.Social, Twitter, Facebook, Post.News, TikTok and YouTube for the months of September 2022, October 2022, November 2022 and the last 28 days (from December 21, 2022).
I wanted to show all of the platforms in one chart to show the trend but unfortunately this looks terrible. SO, I have created a chart for each platform so you can actually see the raw data. If any of you nerds have a program to make more complex charts that isn’t excel, please send it to me.
All hope isn’t lost! There’s growth happening on Mastodon (kinda) and Post.News (which is only 2 months old).
For context, it took Instagram 67 days to reach 1 million users (the below is visits, not users). Mastodon currently has an estimated 6.8m users. I’ll save my thoughts on these platforms for a later post….
I hope you enjoyed the raw data I put together. I wish I had the app data to compare it to. But also I don’t, because it’s the holidays and I need to log off. As should you…
I will follow-up with a part 2 with analysis and what this all means but in the meantime please let me know your thought. This piece is really a conversation starter.
Please subscribe and share this post. XOXO!


Nice post Liz! I’d love to see the data for longer time period because my assumption is the early to mid pandemic was definitely a peak for platforms like YouTube so I’m wondering if this is all trending down to a pre-pandemic level
Not trying to sound smart—I’m really quite dumb—but when these charts say “website visits” are they talking about visits to their .com pages or is this actually counting visits in their apps?